Your Data Problem Is Actually a Question Problem
We’ve misdiagnosed the symptom.
Companies invest in cleaner data pipelines, fancier visualization tools, and bigger analytics teams—yet still drown in uncertainty. The bottleneck isn’t the data. It’s the questions we’re not asking.
A dashboard with fifty metrics is useless if none address:
- What would make us change our roadmap?
- What’s the riskiest assumption we’re not testing?
- Where are we measuring effort instead of outcomes?
This isn’t a data problem. It’s a question problem.
How Poor Questions Create Data Swamps
The confusion starts early. Most analytics requests begin with:
"Can you pull the churn numbers by cohort?"
Instead of:
"What would we do differently if we knew why power users leave?"
The first question creates busywork. The second forces clarity.
Poor questions beget data swamps—endless reports that satisfy curiosity but never drive action. Teams collect more data to compensate for unclear goals, which only deepens the paralysis.
Example: A SaaS company tracks cancellation reasons (pricing, features, support) but misses the critical question:
"What did these customers assume our product would do that it didn’t?"
That’s not a data gap. It’s a curiosity gap.
The 3 Types of Questions That Actually Move the Needle
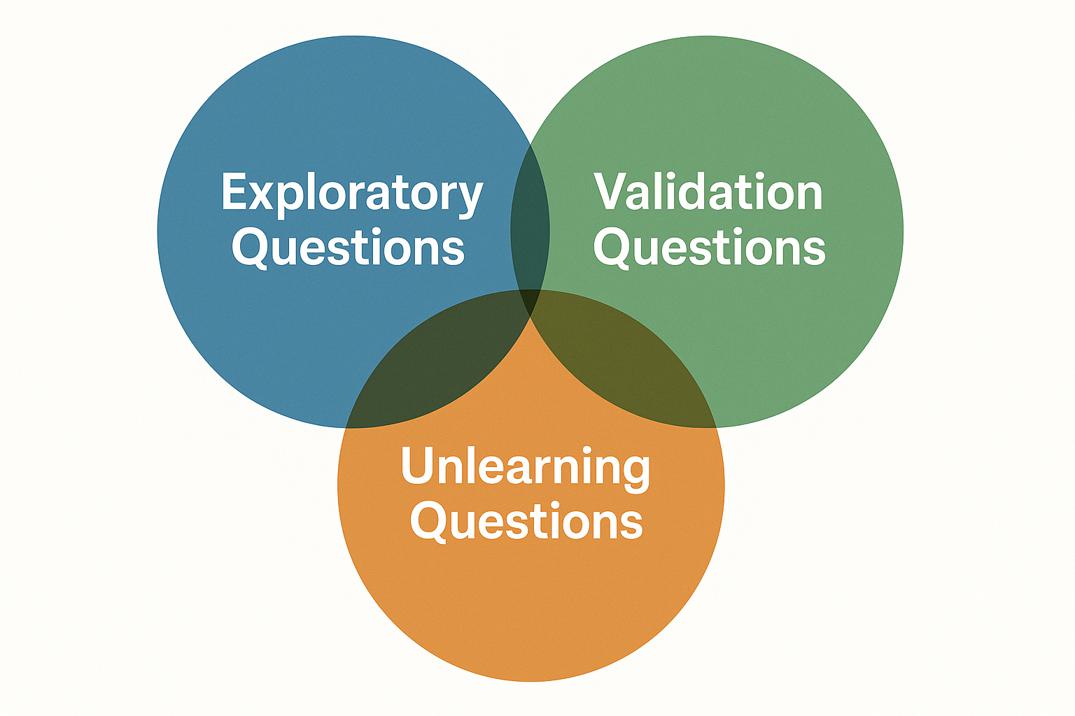
Not all questions are equal. The most effective fall into three frameworks:
1. Exploratory: "What don’t we know that we don’t know?"
Purpose: Surface blind spots. Example: "Why do our most engaged users ignore Feature Y?" → Reveals mismatches between perceived and actual value.
2. Validation: "What assumption are we testing?"
Purpose: Stress-test beliefs. Example: "Does pricing truly correlate with churn, or is it a proxy for onboarding friction?" → Separates symptoms from root causes.
3. Unlearning: "What belief does this data contradict?"
Purpose: Challenge orthodoxy. Example: "Our ‘sticky’ feature actually predicts cancellations—why?" → Forces teams to confront uncomfortable truths.
Key shift: From "more data" to "smarter inquiry".
Case Study: When a Single Question Saved a Failing Feature
A B2B platform spent months optimizing their "most-used" feature—until an analyst asked:
"What if usage correlates with frustration, not value?"
Data showed power users clicked the feature 12x/day because it failed silently. The team had optimized for engagement, not outcomes.
The fix? A single question reframed the problem. They replaced the feature with a simpler workflow, reducing support tickets by 40%.
Lesson: The right question turns noise into signal.
How to Audit Your Team’s Question Quality
Run this diagnostic in your next analytics review:
-
The "So What?" Test For every metric, ask: "What decision does this inform?" → If the answer is "We track it because we always have", cut it.
-
The Assumption Audit List 3 beliefs your data "proves". Now ask: "What would it take to disprove these?" → If no one knows, you’re measuring confirmation, not insight.
-
The Decision Link Before requesting data, write: "If this analysis shows X, we will do Y." → No Y? No analysis.
Red flag: Your team celebrates being "data-driven" but can’t name the last decision data changed.
From Dashboards to Decisions: Building a Question-First Culture
The fix isn’t another BI tool. It’s a mindset shift:
- Start meetings with: "What’s the decision this data should inform?" (Not: "What data do we have?")
- Reward unlearning: Celebrate when data contradicts a belief.
- Measure question quality: Track how often insights lead to action.
The gap between noise and signal? It’s not more data. It’s better questions.
Further Reading
- The Art of Thinking Clearly (Rolf Dobelli) – On cognitive biases in data interpretation.
- Good Strategy Bad Strategy (Richard Rumelt) – Diagnosing the "question problem" in business.
Discussion
What’s one question your team should be asking but isn’t? (Note: No call-to-action hype. The question stands alone as an invitation for reflection.)